In this chapter, you will understand and demonstrate knowledge in the following areas:
| Tuning the shared pool | |
| Tuning redo mechanisms | |
| Tuning the buffer cache |
After tuning SQL statements and the applications that use them, tuning memory can yield the greatest performance benefit on the database. Unfortunately, upon leaving the insulated world of SQL tuning for the adventure of exploring SGA, the DBA leaves behind the advantage of knowing that the changes he or she is making won’t adversely affect another area of the database. Tuning memory utilization on the Oracle database is tricky because memory (and disk I/O) resources are a global need—and if that global need is changed in a way that doesn’t work, it is a problem for everyone using the Oracle database. Tuning memory utilization comprises a major component of the DBA’s skills, and is also the largest percentage component of Oracle Certification in the area of performance tuning. The material in this chapter covers about 30 percent of OCP Exam 4.
In this section, you will cover the following topics related to tuning the shared pool:
| Identifying objects kept in the shared pool | |
| Measuring the shared pool hit ratio | |
| Monitoring latches to detect shared pool contention | |
| Sizing the shared pool | |
| Pinning objects in the shared pool |
This section covers several different topics related to the area of the Oracle SGA called the shared pool. This section will cover several different discussions related to the shared pool. The first is identifying objects kept in the shared pool. After identifying the objects in the shared pool, the DBA will learn about measuring the shared pool hit ratio. Next, monitoring latch performance to detect shared pool contention is covered. After that topic, the DBA learns about sizing the shared pool. Finally, the topic of pinning objects in the shared pool is covered.
One of the two main memory structures in Oracle is the System Global Area, or SGA The SGA consists of several components, as indicated in Figure 18-1. Those components are the shared pool, the redo log buffer, and the buffer cache. The ordering of items in this statement is not coincidental. Oracle recommends that priority be given when allocating memory in database configuration to the memory structures in the order they are listed above. The rationale is as follows. Users are the most important feature of any database system. At the database memory level, this design translates to the ability for users to run the application that they are capable of running; that is, memory should not be the restricting factor on the types of queries or application activities users run. The areas of memory dedicated to running the processes of users—that is, the shared pool and the buffer cache—should have first priority when the DBA attempts to size the memory allocation of the database.
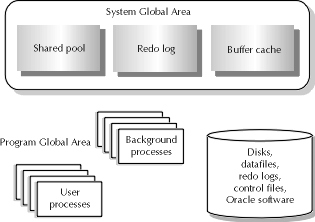
Figure 1: Review of the Oracle architecture
In this discussion, we will discuss the contents of the shared pool itself and various components of understanding and tuning the shared pool. The shared pool contains three main elements: the row cache (also called the dictionary cache) and the library cache, and control structures such as network security attributes and other things.
In turn, each of these structures contain some elements. The library cache contains the shared SQL area, PL/SQL packages and procedures, and certain control structures like locks, library cache handles or addresses in memory, along with other things. The shared SQL area is a place in memory where SQL statements are turned into a series of operations for Oracle to perform in order to obtain requested data. The PL/SQL packages are stored in the library cache in their compiled form as well. Finally, certain control structures such as locks are also stored in the library cache.
The purpose of the row cache is to store rows of information from the data dictionary in memory for faster access. Since both users and Oracle use the data dictionary heavily, the row cache is designed to give fast access to that data. The row cache is designed to hold the actual rows of data from objects in the data dictionary. While this data is held in the row cache, the users of the database may access that information more quickly than if Oracle had to read the data into memory from disk.
The hit ratios for each component of the shared pool is calculated based on performance information from the V$ performance views in the data dictionary. This discussion will present the views used for calculating those hit ratios, along with the appropriate formulas.
Activity in the row cache is monitored by a dynamic performance view called V$ROWCACHE. This dynamic performance view stores statistics about row cache performance. As with other dynamic performance views discussed this far, the V$ROWCACHE view is accessed only by those users granted the select any table object privilege and the owner of the dynamic performance view, SYS. Some examples of users with the select any table privilege are those users with the sysdba privilege granted to them.
Monitoring performance using the V$ROWCACHE view is accomplished by checking the rows in the view that correspond to the row type the DBA wishes to monitor. The statistics maintained for each row in the V$ROWCACHE view corresponds directly to the use of that particular item in the row cache. The columns for determining row cache performance are PARAMETER for identifying each row in V$ROWCACHE with a meaningful name, and CACHE#, which is the unique identifier for each row in V$ROWCACHE. There is a naming convention associated with the PARAMETER column. Not only are all values in this column stored in lowercase, but they are also prefixed by a ‘dc_.’ It is important to note the convention used in the event that the DBA is attempting to find something in the V$ROWCACHE view and can’t.
Data in V$ROWCACHE is treated as an aggregate. The DBA will base all statistical calculations on the sum of the GETS column and the GETMISSES column data for all rows in the view. The first column contains performance data of a somewhat dissimilar nature to what the meaning that its name suggests. The GETS column contains the number of times a process or Oracle asked for the item named in the PARAMETER column. This column tracks statistics for the total number of requests for a particular item made by users on the database and Oracle itself. Notice that this definition says total number, not just the ones that ended with a successful "get." The other column, GETMISSES is the number of times a request for information from the row cache ended in a cache miss. A cache miss means that a server process had to go out to the SYSTEM tablespace to retrieve data dictionary rows corresponding to that named entry on V$ROWCACHE. Retrieving data from disk decreases system performance and creates additional I/O overhead.
Usage of V$ROWCACHE for deriving the necessary row cache hit ratio will now be discussed. Remember that earlier in the section it was explained that for the purposes of deriving this statistic, the data in the V$ROWCACHE dynamic performance view of row cache should be treated as an aggregate pool of statistical information for the row cache as a whole. This ratio, as with other hit ratios that will be discussed, represents the number of times an object was requested and not in memory vs. the total number of requests for that data. The general formula is (MISSES / TOTAL REQUESTS) * 100. Misses is represented by the statistic collected for each row within the GETMISSES column and total requests is represented by the statistic collected in the GETS column. The ratio required for determining performance on this cache can be derived by executing the following query under the appropriate user, as detailed in the discussion earlier about access privileges and the buffer cache:
SELECT (SUM(getmisses)/SUM(gets))*100 dc_hit_ratio
FROM v$rowcache;
Oracle recommends trying to keep the hit ratio around 10–15%. To improve dictionary cache performance, add memory to the shared pool by increasing the value set for SHARED_POOL_SIZE. However, this method simply adds to the size of the entire shared pool for the database and is not precise enough to add space specifically to the row cache. Another problem with this method is determining how much space to add. SGA usually takes up most of the memory on an Oracle database server. The DBA will want to spend some time making sure that the additional size added to the shared pool does not increase the SGA to a size larger than real memory can handle. If the SGA requires virtual memory, there is a bigger memory performance issue at hand than the row cache.
The other major component to the shared pool of the Oracle System Global Area is the library cache. This area of memory is utilized by all applications and user processes of the database, as well as the SQL execution mechanism of the Oracle database. The library cache stores all shared SQL and PL/SQL blocks, along with their parse trees. The library cache represents a unique approach to attempting to manage memory size as efficiently as possible. Oracle attempts to minimize the amount of memory a database user requires by creating a memory structure that permits the sharing of part of the SQL queries being executed. Of course, the values placed in a SQL statement bind variable will not be available to other users, to maintain security and data integrity in the database.
Effective performance in the library cache benefits the user population overall in the following way. If many users are writing or executing the same blocks of code, say an ad hoc report or a data update, insert, or delete statement, or a stored procedure, then the parse tree for that block of code is created once and then reused until it is eliminated from the library cache. In high-usage environments, such as OLTP environments where great numbers of users are entering and changing data, there is a great chance for overlapping the parse and execute needs of those different queries. Such an overlap in the library cache is called a library cache hit. However, even if many users execute the same queries on the database, there may be a chance that the users will experience a performance lag because the parse information they need has been eliminated from the library cache. In these cases, a user coming along with SQL to execute that is not already in the shared pool will experience a library cache miss. This miss results in the user’s need to have the SQL they are executing reparsed by the Oracle SQL execution mechanism.
Key to ensuring the performance of the Oracle library cache is monitoring the activity of that cache. The view used for monitoring statistics on the library cache is called V$LIBRARYCACHE. As with other V$ views, access to the V$LIBRARYCACHE is limited to those users with select any table access and the owner of the view, SYS. Each record in this view tracks statistics associated with library cache hits and misses associated with different types of SQL code blocks.
There is an associated cache hit ratio that can be calculated to ensure good performance on the cache. The library cache is no exception. The V$LIBRARYCACHE consists of several columns, three of which are useful for this discussion of how to obtain the library cache hit ratio. Those three columns are the NAMESPACE, PINS, and RELOADS columns. The NAMESPACE column allows for easy identification of different types of library cache activity associated with SQL statements and other structures Oracle maintains for internal purposes. The most common row values for the NAMESPACE columns that the DBA will use to gauge performance on will be the SQL AREA, TABLE/PROCEDURE, BODY, and TRIGGER SQL types. Unlike its cousin used for tracking statistics associated with the row cache, the NAMESPACE column attempts to put a friendly name on each row and also represents the unique identifier for that row.
The statistic tracked in the PINS column of each row corresponds to the number of times a SQL statement, PL/SQL block, table, or trigger was accessed for execution in the library cache. Every time a block of SQL code is executed as part of a process, if it has not been parsed already and is sitting in the library cache, Oracle will parse the statement and add it to the library cache. Finally, the last column to be discussed is the RELOADS column. It tracks the number of times a user attempted to execute a previously parsed statement only to find that the parsed statement had been flushed from the cache. This is also known as an execution miss. If there is a time lag between statement parsing and execution, the execute portion may have to reload the parse. Reloading the parse essentially consists of reparsing the statement, and costs the Oracle database some loss of performance.
Determining the library cache miss ratio from the V$LIBRARYCACHE dynamic performance view is similar in formula to that of every other hit ratio calculation, namely (MISSES/TOTAL REQUESTS)*100. The value from the MISSES column in this equation equals the sum of the number of reloads for all rows in V$LIBRARYCACHE and the total requests is equal to the sum of the number of pins for all rows in the same dynamic performance view.
SELECT (SUM(reloads)/SUM(pins))*100 lc_hit_ratio
FROM v$librarycache;
Reloads are bad for performance of SQL statements. Ideally, the library cache miss ratio should be under 1 percent. The higher the number of reloads, the higher the hit ratio, and the faster the rate that Oracle is eliminating parse trees from the library cache before users and other processes can execute based on the parse. Assume, for example, that the sum of pins is 177,392 and the sum of reloads is 4,503. The resultant library cache hit ratio for this example will be 2.5 percent, much higher than the DBA should like to allow.
Two methods are available for improving library cache hits on the database. The first is similar to the only method offered to improve hits on the row cache—increase the size of the shared pool as reflected by increasing the value set in the SHARED_POOL_SIZE database instance initialization parameter. This method primarily addresses the problem of high numbers of reloads appearing as a result of parse trees getting eliminated from the buffer cache. Additional space can be allocated by increasing the number of cursors allowed per session with the OPEN_CURSORS initialization parameter.
The other method requires more work and most likely will not be accomplished by the DBA alone. This method is to set it up such that the applications accessing the database execute more identical SQL queries. Since a SQL query must be identical for the principle of overlap that the library cache design thrives on to work properly, the more queries that are identical, the lower the number of misses on parse calls that will occur
The shared pool is a resource that is sought after by much of the Oracle instance. Processes are always looking for space in the shared pool to set up their SQL parsing, or are looking to use an existing parse tree if one is available to them. However, like other Oracle resources, there have to be limits to the usage in order to avoid problems with the integrity or availability of the resource. With most Oracle system structures, there are control mechanisms called latches that limit the amount of time and space any single process can command the resource at any given time. An introduction to the use of latches is included in Chapter 16. Monitoring database resources to determine if there is a problem with contention is accomplished by monitoring the latch that corresponds to the resource.
As with any other monitoring exercise, there are V$ dynamic performance views provided by Oracle to assist in the task of observing the performance of the resource. In this case, there are two views that accomplish the task, a discussion of which appear in Chapter 16. They are V$LATCH and V$LATCHHOLDER. V$LATCH gives information about each latch in the system, like the number of times a process waited for and obtained the latch. Processes that request latches to perform activities using Oracle resources do not always obtain the latch the first time they request them. There are two behaviors that processes will undertake when they need to use a latch and find that the latch is not available for their usage. These behaviors are the process will wait for the latch to become available for the process’s usage, or the process will not wait for the latch to become available, but instead will move on within its own process.
The other dynamic performance view, V$LATCHHOLDER, handles identifying the processes running on the database that are holding latches. These particular processes can be elements causing waits on the system. A query against V$LATCHHOLDER will allow the user to identify the process ID for all processes holding the latches. Since the period of time that any process will hold a latch is very brief, the task of identifying waits on the system, as discussed earlier, can be accomplished by continuously monitoring V$LATCHHOLDER to see which users are holding latches excessively. If there are processes that are holding latches for a long while, then performance for all processes that are waiting for the latch to be free will wait as well. This fact is an important piece of information related to latches that helps determine if there is a more serious problem associated with latch waits on the system. The following code block illustrates how to obtain the name of each latch, the process holding it, and the wait ratio for all latches in the database:
SELECT h.pid, n.name, (l.misses/l.gets)*100 wait_ratio
FROM v$latchholder h, v$latchname n, v$latch l
WHERE h.laddr = l.addr
AND l.latch# = n.latch#;
Consistent monitoring of these V$ performance views yields the following: If the same process shows up time and time again as holding the latch named, and the wait ratio is high for that latch, then there could be a problem with an event causing a wait on the system.
To find out more about the events or processes that are suffering as a result of an event causing waits, the V$PROCESS view can be incorporated into play. V$PROCESS has a special column associated with it that identifies the address of a latch for which that process is currently experiencing a wait. This column is usually NULL, but if there is a value present for it then there is a wait happening. Associating the latch name and wait ratio can be accomplished with an extension of the query already identified. See the following:
SELECT p.pid, n.name, (l.misses/l.gets)*100 AS wait_ratio
FROM v$process p, v$latchname n, v$latch l
WHERE p.latchwait is not null
AND p.latchwait = l.addr
AND l.latch# = n.latch#;
The execution of this query produces the process ID for a process experiencing the wait, the name of the latch that is currently held by another process, and the wait ratio for that latch overall. The functionality that these V$ views give can be better managed with use of Server Manager.
To improve the performance of the dictionary cache or the library cache, add memory to the shared pool. This is done by increasing SHARED_POOL_SIZE. However, this method simply adds to the size of the entire shared pool for the database and is not precise enough to add space specifically to the row cache. This same method can be used to improve hits on the row cache. This method primarily addresses the problem of high numbers of reloads appearing as a result of parse trees getting eliminated from the library cache. Additional space can be allocated by increasing the number of cursors allowed per session with the OPEN_CURSORS initialization parameter.
The most effective way to add memory to the shared pool without adversely impacting the database instance or the rest of the processes on the machine (if any) is to add real memory to the machine hosting Oracle. Memory is added by placing memory chips or cards to the actual hardware of the system, then allocating that new memory to the Oracle shared pool. However, real memory costs money and funds can be in short supply, especially around the time that the system needs it. So the DBA sometimes must juggle the available memory away from another part of the SGA temporarily from another part of the database in order to give it to the shared pool. One area the DBA may take space from is the database buffer cache. The mechanics for resizing the buffer cache are covered in the section titled "Tuning the Buffer Cache."
Another aspect of appropriate sizing for the shared pool with the SHARED_POOL_SIZE parameter involves the relationship between the contents of the shared pool. The two elements of the shared pool—the row cache and the library cache—eliminate the oldest data when the cache is full and space is needed to store new information corresponding to their various roles. The row cache stores records from the data dictionary tables in memory. Since this data is a bit more static and small, the DBA may find that a properly sized shared pool will store a great deal of dictionary data in memory. In contrast, the library cache area may be somewhat more volatile. The information in the library cache has a tendency to spend less time in memory, depending on the frequency that the SQL statement is duplicated by multiple user processes in the system. The frequency of duplication depends on several factors:
| Ability of users to execute SQL ad hoc vs. usage of "canned" SQL. If the users on the database mostly have the ability to type in their own queries and run them, there may be little opportunity on the system for SQL sharing. This setup will cause statements in the library cache to be flushed from memory faster than if everyone accessed the same limited selection of stored procedures or SQL embedded in a front end. In this scenario, there can be much sharing of SQL. | |
| Size and number of applications permitted access to the database. If there is a large number of applications that can execute different pieces of code against the database, then the potential for library sharing may be diminished. Likewise, if there is only a small application in use on the database containing limited amounts of SQL and PL/SQL blocks, then there can be a high degree of SQL statement parse information library sharing using the library cache. | |
| Associated transaction volumes on the system. On large systems with many users that utilize different applications, there may be little opportunity to reuse or share SQL parse information because so many users are accessing the system that shared SQL gets eliminated quickly from the system. In this case, there may even be a problem with the amount of reloads taking place in the system as well. In contrast, on databases with fewer queries being put against the data, there could be a high amount of reuse. |
In general, the data in the library cache will be eliminated faster than data in its shared pool cousin, the row cache, due to the decreased amount of data and change volatility that the row cache will deal with.
Finally, the importance of making sure that the entire SGA fits into real memory can never be overstated. To further define the discussion, real memory is memory space that is actually contained on memory chips or cards. Virtual memory is stored on the system disks as swap space. If the SGA uses any virtual memory at all, the system can take a major performance dive as Oracle attempts to page blocks into memory and onto swap disk space while it attempts to update data blocks. The result is that the database will spend a great deal of time "thrashing" data between memory and swap space, creating a major performance problem.
At times, performance may be crucial for a certain block of code. For example, an organization may have a mission-critical data feed that needs to happen in a short period of time. In some older versions of Oracle, there may also be problems with fitting large PL/SQL blocks into shared memory in order to even parse and execute the code. Whatever the reason, it may be necessary to place objects into the library cache in such a way that the shared SQL will not be paged out of the shared pool. This method is known as pinning the shared SQL in the shared pool.
The process for pinning shared SQL into the shared pool is accomplished as follows. There are several stored procedures provided by Oracle as part of the software release that can be used for the purposes of manipulating the shared pool. The package name containing these stored procedures is DBMS_SHARED_POOL. This package must be created before using it. From within Server Manager, execute the following SQL scripts located in the rdbms/admin subdirectory of the Oracle software home directory: dbmspool.sql and prvtpool.sql.
Svrmgr> @dbmspool
Package created.
Svrmgr> @prvtpool
Package body created.
Svrmgr>
Once the DBMS_SHARED_POOL package is created in the database, the DBA can then pin objects into the shared pool. But first, the DBA should rid the shared pool of all shared SQL information and all cached dictionary objects. This "flush" temporarily frees all space in the shared pool for new SQL statements to come in and parse; however, it temporarily reduces performance for other statements running on the system The statement for flushing the shared pool that the DBA must use is alter system flush shared pool.
ALTER SYSTEM
After restarting the instance, the DBA should reference the object code in some way, either by executing all of it or some portion of it. This execution causes Oracle to parse the code—either a cursor, procedure, or trigger—which places the code in the shared SQL pool. ONLY WHEN THE CODE IS IN THE SHARED POOL CAN IT BE PINNED. Once the shared SQL code is in the shared pool, the DBA executes the keep( ) procedure.
set serveroutput on size 5000;
Interpreting the statement above is as follows. The set serveroutput on command allows Oracle to give printed feedback to the session from a stored procedure. The set serveroutput on command enables the feedback functionality, and the SIZE parameter sets the size of the output buffer in bytes to whatever number is specified. The obj and type variables passed to the keep( ) procedure mean the following: obj is the name of the object being pinned and type defines what kind of object is being pinned. Acceptable values for the type variable are P—for procedure, C—for cursor, and R—for trigger.
Obj IN VARCHAR2;
Type IN CHAR;
In this section, you will cover the following topics related to tuning redo mechanisms:
| Determining contention between ARCH and LGWR | |
| Setting appropriate checkpoint intervals | |
| Determining contention for the redo log buffer | |
| Sizing the redo log buffer | |
| Relieving contention for the redo allocation latch |
Every SQL change operation on the database requires the online redo log resource in order to complete its transaction. The pressure on availability for the online redo log is in direct proportion to the number of users making changes to the database at any given time. Contention for redo log resources is particularly detrimental to the system as a whole because of the heavy dependence every process has on redo logs.
Consider the roles of two background processes in the important activity of redo log archiving. These processes are LGWR and ARCH. As transactions change data, they must also write redo information to the redo log buffer. Once those transactions commit, or when the redo log buffer fills, LGWR assigns each transaction a system change number (SCN) and writes redo log entries to the online redo log group on disk. When automatic archiving of redo information is used, ARCH copies the filled redo logs to an archival destination when a log switch occurs. For more on automatic archiving, review the discussion of enabling archiving that appears in Chapter 13.
Log switches occur during the normal processing of a database that archives its redo logs automatically. At the point of a log switch, LGWR stops writing redo information to the current redo log group, because the redo log is full, and starts writing information to another group. When the log switch occurs, ARCH is then able to write the recently filled online redo log to LOG_ARCHIVE_DEST. As demonstrated in Figure 18-2, if all online redo logs are stored on the same disk, the LGWR and ARCH processes will contend as ARCH attempts to archive the filled redo log and LGWR attempts to write the online redo log. To resolve this situation, the DBA must multiplex the members of each redo log group onto separate disks.
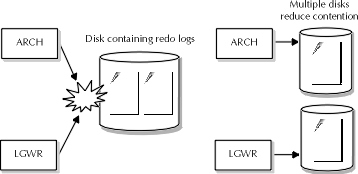
Figure 2: Contention between ARCH and LGWR
Another form of "contention" may occur between ARCH and LGWR. If for some reason, such as block corruption or disk unavailability, the ARCH process cannot write the recently filled redo log to LOG_ARCHIVE_DEST, then ARCH will attempt to write the archive from another redo log member. If ARCH cannot write a redo log archive from any redo log member, then archiving stops. LGWR will continue writing redo log information to the online redo logs until it fills all redo logs. Since archiving is enabled, LGWR cannot overwrite any online redo log that hasn’t been archived. So, if all redo logs fill and archiving has stopped, LGWR cannot write redo information out of the redo log buffer, and database operation must cease until archiving can be restarted. Thus, the ARCH and LGWR processes will contend if for some reason a redo log cannot be archived. The way to avoid this conflict is to ensure that ARCH is archiving redo logs faster than LGWR can fill them. Usually, this situation will be the case unless there is some data corruption in the redo log that forces ARCH to be unable to write the archive.
One of the events that occur at the time of a log switch is a checkpoint. When a checkpoint occurs, several things are done by LGWR. First, LGWR writes the redo log sequence number to the datafiles and the control files of the database. Each redo log is assigned a sequence number to identify it uniquely to Oracle for archiving and recovery purposes. Also, LGWR tells DBWR to write the blocks in the dirty buffer write queue to the appropriate datafiles of the database. When a checkpoint occurs, LGWR momentarily stops writing information from the redo log buffer to the online redo log in order to handle these other activities.
More frequent checkpoint intervals decrease the recovery time of the database because dirty buffers in the buffer cache are written to disk more frequently. In the event of an instance failure, the dirty buffers that are still in the buffer cache are lost by Oracle, and must be recovered from online redo log information. More frequent checkpoints means that fewer of these dirty blocks must be recovered during instance recovery, thus improving recovery time. However, more time spent handling checkpoints is less time spent writing redo information from memory to disk by LGWR, potentially slowing database processing time if there is a high amount of transaction activity.
On one hand, users want their transactions to run quickly, particularly on OLTP systems. Less frequent checkpoint intervals may be used to reduce the burden on LGWR. But, on the other hand, users want fast recovery in the event of system failure. The more often the checkpoint intervals, the more efficient the database recovery. But the opportunity cost is in the application code that has to wait until the recovery information is saved before continuing. Such is the trade-off between the reliability of having many checkpoints and poor online performance while those checkpoints happen. This trade-off may be particularly painful on OLTP systems, giving rise to a certain paradox. Users want maximum online performance, pushing DBAs to reduce the number of checkpoints performed. But, users also want maximum database availability, pushing DBAs to increase the number of checkpoints performed in order to minimize downtime.
There are two solutions for improving the way LGWR handles checkpoints. The first is to give LGWR some help. In order to reduce the burden on LGWR to handle checkpoints, the DBA can allow the checkpoints to be handled by a special Oracle background process called CKPT. This process handles the writing of log sequence numbers to the datafiles and control files when it is enabled, allowing LGWR to return to the task of writing redo information from the redo buffer to disk after telling DBWR to write the dirty buffers. If the data in the system is volatile yet requires fast instance recovery, starting the CKPT process can allow the DBA to perform frequent checkpoints without diminishing online transaction processing performance. To enable CKPT, set the value for the CHECKPOINT_PROCESS initialization parameter to TRUE and restart the instance.
Alternately, decreasing the number of checkpoints reduces the number of times LGWR must perform the tasks involved. Although during the checkpoint itself, performance will still degrade, this event will occur less frequently. The changing of checkpoint intervals is accomplished by adjusting the LOG_CHECKPOINT_INTERVAL to a size higher than the largest redo log file or by setting the LOG_CHECKPOINT_TIMEOUT to zero in order to eliminate checkpoints based on time. Of course, there is no way to eliminate checkpoints entirely. Since checkpoints occur every time a log switch occurs, the only further reduction to the number of checkpoints is to increase the size of the redo log files, which reduces the frequency of checkpoints because the redo logs take more time to reach their capacity.
Every user process in the database must write redo information to the redo log buffer. In order to write that redo information, the user process must acquire the redo log resource by requesting and obtaining the redo allocation latch. There are two types of requests for the redo allocation latch, based on whether the process can stop whatever it is doing and is willing to wait for the latch, or whether the process requires immediate access to the latch, and will not wait if it cannot acquire the latch. "Willing-to-wait" processes will do the following when requesting the redo allocation latch:
The next important aspect of finding out if poor process handling of the redo allocation latch is causing other processes to wait to write redo log entries is calculation of the wait ratio for a latch. The DBA can obtain the wait ratio for a given latch by executing the following query against Oracle. If either the wait ratio on willing to wait or the immediate latch requests for the latch named by the DBA in the query are greater than 1 percent, then there is a problem with latch contention in the database.
SELECT n.name,(l.misses/l.gets)*100 w2wait_ratio,
(l.immediate_misses/l.immediate_gets)*100 immed_ratio,
FROM v$latch l, v$latchname n
WHERE n.name in (‘redo allocation’)
AND n.latch# = l.latch#;
Within the redo log buffer, there can be issues with available space for writing of redo log entries to the online redo log. A redo log entry is usually not written to disk until the user process commits it. If the user has a long-running process and there are a lot of other processes that need the space, Oracle may flush the redo log buffer to reduce the number of redo log buffer waits that are occurring on the database. Flushing the redo log buffer causes LGWR to write all data in the redo log buffer to the online redo log, whether the transaction has been committed or not. A statistic is tracked by the Oracle performance view V$SYSSTAT that maintains track of the number of times that user processes wait to obtain space in the redo log buffer in order to write their redo log entries. This statistic is obtained by executing a select on the NAME and VALUE columns from V$SYSSTAT where the name is ‘redo log space requests’.
SELECT NAME, VALUE
FROM v$sysstat
WHERE NAME = ‘redo log space requests’;
Depending on how often user processes have to wait for the redo log buffer to free up some space, the DBA may want to consider increasing its size. Oracle recommends that DBAs monitor the V$SYSSTAT view regularly for increases in the number of redo log space requests. If those redo log space requests increase rapidly and consistently over time, then an increase to the size of the redo log buffer may be required. Increasing the size of the redo log buffer is accomplished by changing the value for the initialization parameter LOG_BUFFER, which is expressed in bytes.
As with any increase in the size of a portion of memory, care should be taken in order to avoid sizing the SGA out of real memory. If the SGA uses any virtual memory at all, the system can take a major performance dive as Oracle attempts to page blocks into memory and onto swap disk space while it attempts to update blocks. The result is that the database will spend a great deal of time "thrashing" data between memory and swap space, creating a major performance problem.
Recall from earlier in this discussion and in Chapter 16 that database change information must be recorded in the redo log buffer by user processes. A user’s ability to write redo to the redo log buffer is moderated by the redo allocation latch. The user process must first obtain the redo allocation latch to allocate space in the buffer. There is only one redo allocation latch in the Oracle instance. This design choice was made to ensure sequential database redo for database recovery. After obtaining the latch, the user process updates the redo log buffer.
The space in the redo log buffer allocated by the redo allocation latch for a user process’s redo is determined in bytes at instance startup with the LOG_SMALL_ENTRY_MAX_SIZE initialization parameter. If the redo information the user process must write exceeds the value set by LOG_SMALL_ENTRY_MAX_SIZE, the user process must acquire the redo copy latch in order to write the redo information to the redo log buffer as well. The range of values, as well as the default for this initialization parameter, depends on the operating system. The DBA should keep the time that any process holds the latch as short as possible to avoid contention problems by reducing the value for LOG_SMALL_ENTRY_MAX_SIZE. Reducing this value means that a smaller number of redo log entries can be copied to the redo log buffer when the redo allocation latch is obtained, and the allowed size of the redo log entry written on the latch is smaller as well.
Since there can be only one redo allocation latch on the database, the DBA should minimize the time any user process holds the latch. To reduce the time each user spends writing redo log information while it holds the redo allocation latch, the DBA can configure Oracle to require user processes to build their redo log entries before requesting the redo allocation latch. This process is known as prebuilding the redo log entry. To configure Oracle to require user processes to prebuild redo entries, the DBA can set LOG_ENTRY_PREBUILD_THRESHOLD to an appropriate size. This initialization parameter is expressed in bytes. Be default, its value is zero, hence no prebuilding occurs by default in the Oracle database. When this initialization parameter is set to a value greater than zero, all redo entries smaller than that threshold specified will be prebuilt by the user process before the latch request is made.
In this section, you will cover the following topics related to tuning the buffer cache:
| Calculating the buffer cache hit ratio | |
| Determining whether to resize the buffer cache | |
| Using table caching | |
| Monitoring the buffer cache |
After the shared pool, the buffer cache is the most important part of the Oracle instance. The buffer cache consists of several, sometimes hundreds of, memory buffers, each the same size as DB_BLOCK_SIZE. These buffers are each designed to store one block from disk. User processes never need to deal with disk I/O in Oracle as a result of the buffer cache. The associated server process reads the data blocks into the buffer cache on behalf of the user process and DBWR writes the changes back to disk, if there are any. This section will discuss how to tune the database buffer cache.
Information in memory can be accessed faster than data in datafiles on disks. It makes sense from a performance perspective for Oracle to keep as many data blocks stored in memory as it can without exceeding the amount of physical memory available on the host machine. Hence, Oracle has the database buffer cache. However, simply having the space to store thousands of data blocks isn’t enough. Oracle attempts to store the right data blocks, those blocks used most frequently by user processes.
The size of the database buffer cache is determined by the DB_BLOCK_BUFFERS initialization parameter. To change the size of the buffer cache, alter the value for this parameter and restart the instance. The size of each buffer depends on the size of blocks in the database, determined by the DB_BLOCK_SIZE parameter. Blocks enter the buffer cache by means of server processes acting on behalf of user processes. The DBWR process writes changed buffers back to disk and eliminates other unnecessary blocks. DBWR writes changed, or "dirty," buffers to disk when one of the three following conditions is TRUE:
| The DBWR time-out occurs (every three seconds) | |
| A checkpoint occurs | |
| When a scan of the buffer cache shows that there are no free buffers |
When a scan of the buffer cache shows that there are no free buffers, DBWR determines which blocks to eliminate based on a least recently used algorithm, or LRU. The LRU is based on the idea that blocks recently added to the queue are more likely to be used repeatedly than blocks added a long time ago. Having a block required by a user process in the buffer cache already is called a buffer cache hit. Hits are good because they reduce the amount of disk I/O required for the user process.
To determine buffer cache hits, the DBA can use the V$SYSSTAT dynamic performance view to calculate the buffer cache hit ratio. The V$SYSSTAT dynamic performance view is available only to users with select any table access and to the SYS user. There are three statistics tracked in that performance view that are of use in calculating hit statistics: database block gets, consistent gets, and physical reads. The hit ratio is determined by the sum of the two "get" statistics (the total number of instance data requests), divided by the number of physical reads. The formula is as follows: (physical reads / (db block gets + consistent gets)) * 100. Since all data for this query comes from the V$SYSSTAT view, it is simple to pull all data required for this calculation by selecting the NAME and VALUE columns from V$SYSSTAT view where the name is either ‘db block gets’, ‘consistent gets’, or ‘physical reads’. Make sure to key in the names in lowercase and put spaces between each word.
SELECT decode(name,‘physical reads’,value)/
(decode(name,‘consistent gets’,value)+decode(name,‘db block
gets’,value))
AS hit_ratio
FROM v$sysstat
WHERE name IN (‘db block gets’,‘consistent gets’,‘physical
reads’);
A higher hit ratio according to this formula means the database is accessing a high number of data blocks in memory, performing few physical reads. A low hit ratio means that the database is not storing many blocks in memory that it requires for SQL statements being processed, which requires it to perform many physical reads of data blocks into the buffer cache. The breakdown of value ranges for database buffer cache hit ratios and their meanings are listed here:
| 95–100% | Buffer cache is experiencing few physical reads. Current size is optimal, if a bit high. It should be OK to remove buffers from the buffer cache if memory is needed elsewhere. |
| 70–94% | Buffer cache is experiencing low to moderate number of physical reads required to access data blocks. DBA may want to resize only if there is a serious problem with memory on the Oracle database. |
| 60–69% | Buffer cache is experiencing moderate to high number of physical reads. DBA should consider adding more buffers to the database buffer cache to improve the hit ratio. |
If the buffer cache hit ratio is extremely high or low, or if there is a problem with memory allocation on the database, the DBA may need to resize the buffer cache in order to balance memory allocation to the different components of the SGA. In order to determine the effects of resizing the buffer cache, the DBA needs some means of comparison to determine how adding or subtracting buffers will impact the number of buffer cache hits that occur on the database. This means of comparison may help the DBA to weigh the trade-off of juggling available memory or swallowing the expense for adding additional memory for the host machine running Oracle.
In cases where the buffer cache hit ratio is low, it may help the DBA to add space to the buffer cache by increasing DB_BLOCK_BUFFERS. To understand better the impact of increasing DB_BLOCK_BUFFERS, Oracle offers a feature that can collect statistics that allow for estimation of the gain in performance that would come as a result of adding more space to make the buffer cache larger. This functionality is provided by a special performance view called X$KCBRBH, owned by user SYS. Unlike V$ performance tables, which can be accessed by users granted the select any table privilege, X$KCBRBH can only be accessed by logging onto the database as the owner of the view, SYS. Each row in this view offers the relative performance gain of adding more buffers to the buffer cache.
The X$KCBRBH table has two columns on it. The first column discussed is INDX. For each row of data, INDX stores a sequential value that equals the number of buffers that could be added minus 1. According to this definition, the first row of X$KCBRBH will contain and INDX value of 0, the next row 1, and so on. The other column stored in X$KCBRBH is called COUNT. This column stores a statistic that corresponds to each INDX value that represents the number of estimated cache hits that can be obtained by adding a number of buffers to the database buffer cache equal to INDX+1.
INDX COUNT
---- -----
0 3
1 14
2 28
3 34
4 50
5 90
6 40
7 39
As the INDX value goes up, the count also increases, but only to a certain point. After that point, the count goes back down again. Although the data above is an example, it illustrates in interesting twist on the economic principle of diminishing marginal utility. In fact, there is a threshold where it does not matter how much new space is added to the buffer cache—the hit ratio simply won’t increase appreciably. It is by taking note of where this threshold occurs that the DBA is able to identify how many blocks to add to the system.
Collection of the statistics that X$KCBRBH displays is driven by the use of the DB_BLOCK_LRU_EXTENDED_STATISTICS instance initialization parameter. This parameter accepts an integer value. The default integer specified for this parameter is zero (0). As such, the X$KCBRBH performance view will not collect statistics enabling the DBA to identify the benefits of adding more buffers to the cache. However, since the collection of statistics to this view costs the Oracle instance some processing power, it is usually worth leaving the value for DB_BLOCK_EXTENDED_LRU_STATISTICS alone, unless the DBA wants to use this performance view to determine the right number of buffers for the purpose of sizing the buffer cache. When doing so, there should be some advance planning involved. Since the statistics collected in X$KCBRBH rely on statistics collected in the V$SYSSTAT view, and any data collected in any performance view is valid for only the current instance. With those things in mind, setting the initialization parameter DB_BLOCK_LRU_EXTENDED_STATISTICS to a nonzero value will need to be tolerated for the period of time it takes for the underlying performance views to gather meaningful data. Once that data is gathered, however, there is no further reason to keep collection data for the X$KCBRBH view. One final note: The value chosen for the initialization parameter DB_BLOCK_LRU_EXTENDED_STATISTICS will be the number of rows collected by X$KCBRBH.
Simply listing out the number of additional buffer cache hits that would occur as a result of adding one extra buffer to this table is not the only feature of this information in X$KCBRBH. Each row shows the additional buffer cache hits that would occur as a result of adding just that one extra buffer. The DBA can use that information as a statistical base to derive how many additional hits would occur if the DBA added lots of extra buffers. For example, the DBA may use the X$KCBRBH view to determine how many additional cache hits would occur as a result of adding 50 extra buffers.
SELECT SUM(count) adtl_hits
FROM X$KCBRBH
WHERE indx < 50;
Notice that the where clause only specifies collecting the sums for COUNT if the value for INDX is less than 50, not including 50. Since INDX represents the number of buffers potentially being added to the cache, minus one, it is important to remember that there will be a statistic for INDX = 0, or the situation of adding one buffer to the cache. The DBA can then put the additional number of hits given by the larger block buffer size into the larger context of the database buffer cache hit ratio. Assuming the DBA is considering an addition of 100 buffers to the database buffer cache, the data in the V$SYSSTAT view related to the buffer cache hit ratio can be combined with the data in X$KCBRBH.
SELECT (decode(v.name,‘physical reads’,v.value)-SUM(x.count))/
(decode(v.name,‘consistent gets’,v.value)+decode(v.name,‘db block
gets’,v.value))
AS hit_ratio
FROM v$sysstat v, x$kcbrbh x
WHERE v.name IN (‘db block gets’,‘consistent gets’,‘physical
reads’)
AND x.indx < 100;
Notice that the number of physical reads in the calculation of the buffer cache hit ratio is reduced by the number of additional hits produced by adding buffers to the buffer cache. This data comes from X$KCBRBH. Figure 18-2 demonstrates a formula for recalculating the buffer cache hit ratio based on the additional cache hits that would occur when the buffer cache is increased.
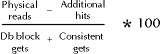
Figure 3: Calculating the hit ratio changed by adding blocks
Although the methods above use the X$KCBRBH view appropriately to determine the proper number of blocks to add to the buffer cache, there are other ways to manipulate the data in X$KCBRBH that better demonstrate the power of these statistics. This data can be grouped together to provide the DBA with the number of hits that would be the result of adding different ranges of buffers to the buffer cache. The following query demonstrates how the statistics in this view may be better manipulated to make an informed decision about adding buffers to the buffer cache without the stepwise refinement that is inherent in the process outlined above:
SELECT 100*TRUNC(indx/num)+1|| ‘-‘|| 100*(TRUNC(indx/100)+1 range,
SUM(count) addtl_hits
FROM x$kcbrbh
GROUP BY TRUNC(indx/100);
Range addtl_hits
------- ----------
1-100 56003
101-200 105033
201-300 1756
The number 100 represents the interval by which the user would like to break out the statistics in order for comparison. The 100 can be substituted with a different number to break the results out according to different range specifications. Each row returned by this query indicates a range of values that could be added to the buffer cache for a gain in cache hits, as indicated by the ADDTL_HITS column. For this example, the DBA may determine that the biggest performance gain is made with an addition of about 200 buffers. Adding more buffers, however, may serve no purpose other than to take up memory unnecessarily.
In some cases, performance in some other area of memory may be hindered, and the DBA may want to determine where to make memory allocation trade-offs. In that situation, the buffer cache hit ratio may be high enough (say, around 90 percent or higher) that it may be worth taking some memory allocation from the buffer cache and putting more memory toward the shared pool, for example. A related view is available from Oracle that will help determine the effects of buffer removal. This view is known as X$KCBCBH.
X$KCBCBH has two columns called INDX and COUNT. The INDX column is the number of buffers currently in the buffer cache, treating the first buffer of the cache as buffer number 0. As a result, there are as many rows in this performance view when it is enabled as there are database block buffers in the database. The COUNT column stores the number of hits that can be directly related to the presence of the corresponding buffer in the cache. The initialization parameter that starts usage of X$KCBCBH is DB_BLOCK_LRU_STATISTICS. This parameter can be set to either TRUE or FALSE. When set to FALSE, statistics for buffer cache hits per buffer will not be collected, while setting the parameter to TRUE enables collection of buffer cache statistics. There is some overhead associated with the statistics gathering process, and it should only be undertaken when sizing the buffer cache or other memory structures.
Reading statistics from X$KCBCBH is done as follows. The generated values refer to cache misses, the additional number of misses that would occur with a smaller number of buffers in the buffer cache. The statistics in this view demonstrate the additional cache misses that will be incurred by reducing the number of buffers in the buffer cache. Refer to the following code block containing SQL code that can be used to assess the impact on the buffer cache hit ratio of reducing the size of the buffer cache. As before, assume that the DBA is considering the impact of a reduction in the hit ratio of the buffer cache for a removal of 100 buffers. The reduction in the buffer cache hit ratio in this case is reflected by a formula demonstrate in Figure 18-3.
SELECT (decode(v.name,‘physical reads’,v.value)+SUM(x.count))/
(decode(v.name,‘consistent gets’,v.value)+decode(v.name,‘db block
gets’,v.value))
AS hit_ratio
FROM v$sysstat v, x$kcbcbh x
WHERE v.name IN (‘db block gets’,‘consistent gets’,‘physical
reads’)
AND x.indx < 100;
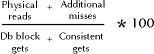
Figure 4: Recalculating hit ratio after subtracting blocks
The additional misses estimated by X$KCBCBH are added to the number of physical reads because an additional miss in the buffer cache will resolve in the V$SYSSTAT view as an additional physical read. Using a similar method as before with the query listed in the following code block, the DBA can eliminate some of the guesswork inherent in the stepwise refinement process covered by producing a report that lists ranges of buffers that could be eliminated along with their corresponding additional cache misses.
SELECT 100*TRUNC(indx/100)+1|| ‘-‘||
num*(TRUNC(indx/100)+1 range,
SUM(count) addtl_misses
FROM x$kcbcbh
WHERE indx > 0
GROUP BY TRUNC(indx/100);
The number 100 represents the interval by which the user would like to break out the statistics in order for comparison. This value can be changed. For example, specifying 30 in place of num may produce output similar to the following:
Range addtl_missesBased on this example, the DBA can then determine if there are buffers that are appropriate for removal. In this case, all ranges seem to contribute heavily, and as such the DBA may find that shedding buffers from the buffer cache is not a wise idea. However, if the numbers for the 61–90 range had been much lower, say around 100, then the DBA may have found reason to eliminate those buffers based on the fact that the number of misses produced would not reduce the hit ratio significantly.
Range additional_hits
------- ------------------
1-50 506
51-100 1179
101-150 214
151-200 95
As stated earlier, the database uses an algorithm to determine how long to keep any given block in the buffer cache, based on the last time it was used. The older a block gets in the buffer cache, the more likely it is that Oracle will eliminate it. This structure is designed to make room for new blocks that processes are requesting while simultaneously keeping each block in the buffer cache long enough in case there is another user who needs it.
There are, however, certain exceptions to this LRU algorithm of buffer cache management. One major exception is made for how Oracle will handle blocks from a table that is currently undergoing a full table scan. If the least recently used algorithm in its purest form applied, Oracle would eliminate other blocks in the buffer cache while performing a full table scan. Although this algorithm will not cause too many problems if the table is small, the algorithm may page out most or all existing blocks from the buffer cache if the table being scanned is large. If the LRU algorithm were not modified, full table scans would be extremely disruptive to other processes simply trying to get a small amount of data. Oracle would have to perform multiple reads in order to satisfy the one process’s request for data while simultaneously trying to satisfy the full table scan’s insatiable appetite for more block buffers. In order to spare other users on the system, Oracle places the blocks that come into the buffer cache as a result of full table scans onto the end of the least recently used list of blocks, so that the full table scan process’s buffers get eliminated first. This last in-first out treatment works for the other processes as well as the full table scan, because the full table scan will only need to look at any buffer that is brought into the buffer cache once, anyway.
In some cases, however, the last in-first out handling of blocks associated with full table scans is detrimental to performance on the system. Sometimes it does not make sense for a table to use extensive indexing, particularly if it is a table that contains validation values and has very few rows. In these cases, the performance of a full table scan is only slightly less effective than an indexed search, and the storage space in the INDEX tablespace benefits from not having to contain an index for that table containing valid values. However, the buffer cache will have to undergo numerous physical reads in this situation because many processes are looking for those valid values, but the blocks are being eliminated by Oracle as fast as the database can put them in the cache.
The answer to this situation is table caching. Oracle makes it possible to keep the entire contents of a table in the buffer cache when a full table scan occurs. Use of this feature should be well planned, as the blocks of the table being cached will become fixtures in the database buffer cache for as long a period of time as it takes for the LRU algorithm to eliminate them in the way it eliminates blocks brought in as part of indexed searches. Proper research on the number of blocks containing table data for the table being cached should be performed. After obtaining the number of blocks containing table data for the table being cached, the number of cache misses should be calculated for the buffer cache again, using X$KCBRBH in order to determine what the buffer cache hit ratio will be for the reduced number of available database buffers. It may take a few iterations of monitoring V$SYSSTAT to verify how many physical reads are reduced by caching the database table along with the increase in physical reads required to make up for cache misses on buffers that have the cached blocks stored in them. In any event, this approach should only be pursued if the buffer cache hit ratio shows a clear improvement as a result of caching a table containing valid values. After deciding to cache a database table, the alter table tablename cache can be used to set up this operation:
ALTER TABLE empl_dept CACHE;
One potentially confusing aspect of this operation is identifying the time that table’s blocks are actually introduced into the buffer cache. Those blocks associated with the table being cached are not read into the buffer cache at the time the statement is executed. Rather, the table is simply earmarked such that, at the time of the next table scan, the blocks read into the buffer cache will be placed in the beginning of the list Oracle maintains to determine which buffers were least recently used.
Obviously, this use of caching is not appropriate for tables with large numbers of rows. However, some of the applications developed on the Oracle database may have great use for this technique in order to reduce the number of physical reads on the buffer cache.
The best indicator of buffer cache performance is the buffer cache hit ratio. Determining the buffer cache hit ratio depends on the proper use of the performance view V$SYSSTAT. The main statistics to refer to on this view are the db block gets, consistent gets, and physical reads. The DBA needs to remember that the buffer cache hit ratio will NEVER be 100. Even if your host machine has gigabytes of memory allocation or more, there will probably still be far more space available on disk.
The contents of this chapter cover the tuning of memory structures in the Oracle database. This discussion covers aspects of performance tuning for the shared pool, the redo log buffer, and the buffer cache. These topics are an important one on the OCP Exam 4, so care should be taken to review the material and answer the questions. This chapter covers 30 percent of the material on OCP Exam 4.
The first area of discussion in this chapter was the tuning of shared SQL pool elements of the SGA. The shared SQL pool consists of some major components required by users of the database. The two major structures that exist in the shared pool are the dictionary, or "row," cache and the library cache. The dictionary cache stores data from rows in data dictionary tables in memory for use by user processes to improve the performance of queries against the data dictionary. The library cache contains several elements, including parsed SQL statements, for the purpose of minimizing storage costs of the parse information and speeding the execution of SQL in the event that multiple users are executing the same statements. Additionally, the library cache contains executable versions of PL/SQL packages and procedures. Finally, the library cache contains control structures like locks and cache handles, or addresses in memory.
Each object in the shared pool is designed to produce improvements in performance on various aspects of the Oracle database. The performance of each of these objects is quantitatively determined using a calculation of a hit ratio. "Hits" are defined relative to the object being quantified. In the case of the row cache, a hit is when a process or Oracle looks for data from the data dictionary and finds it in the row cache. On the library cache, hits are defined as when a process needs to execute a SQL statement and finds it already parsed and waiting in the library cache.
Quantification of the performance for the library cache is accomplished by calculating a hit ratio. The hit ratio is determined first by pulling the relevant statistics from the appropriate dynamic performance view. In this case, the DBA will need to work with the V$LIBRARYCACHE performance view to obtain the statistics collected for the PINS and RELOADS on the library cache. A pin is when the user process needs to parse a statement in the library cache only to find that a parsed version of it already exists in the cache. Since this find occurred, and thus the parse tree was recently used, the parsed statement will stay "pinned" in the buffer cache as a most recently used object. RELOADS represent the number of times Oracle had to reparse a statement because the period of time between the parsing of the statement and the execution of the statement were spaced far enough so that Oracle had actually eliminated the parse tree from the library cache in order to make room for another statement. Reloads indicate that there is either a great deal of activity on the database or a great many unique statements being executed—for example, in the case of many users permitted to run ad hoc SQL against the database. The reload and pin statistics come from the RELOAD and PIN columns of the dynamic performance view V$LIBRARYCACHE. The formula for calculating the hit ratio for the library cache is defined as (RELOADS/PINS) * 100.
In order to quantify this occurrence on the row cache, the dynamic performance view V$ROWCACHE must be queried for the statistics in the GETS and GETMISSES columns to calculate the hit ratio for the row cache. The formula for calculating the hit ratio is (GETMISSES/GETS) * 100. If the result of this query is under about 10–15, then the hit ratio and performance for the library cache should be satisfactory. A value above that may not produce satisfactory performance, either for Oracle or for the user processes.
When there is a performance issue with the library cache or the dictionary cache, the shared pool must be resized. The shared pool needs to be sized in an appropriate manner. The initialization parameter that handles increases shared pool size is SHARED_POOL_SIZE. This variable is measured in bytes. Care should be taken when performing operations that increase the size of any Oracle memory structure to make sure that no part of the SGA is sized out of the real memory that is available for the system. The best approach to increasing the size the shared pool is to keep the overall size of the SGA the same as before, and simply reallocate memory from one area of the SGA to another, or to add physical memory to the hardware and allocate it to Oracle.
It may become useful in some instances to place objects in the shared pool for a long-term basis. The types of objects that the DBA may want to place in the shared pool on that longer-term basis are objects that go in the library cache. This structure stores parsed statement information that can be reused by identical statements executing within the Oracle database. Some reasons for pinning objects in the shared pool include desiring a performance increase for a statement not used frequently enough for Oracle to pin the SQL statement parse information in the system according to the LRU algorithm it uses to eliminate older SQL parse information to make room for new SQL statements; or there is a memory fragmentation issue that prevents a large SQL or PL/SQL block from entering the library cache for parsing. In general, the steps required for pinning objects in the shared pool are:
Redo log mechanisms are the next critical portion of the SGA for which tuning was covered in this chapter. The primary function of the redo log buffer is to store redo entries in memory until LGWR writes them to disk. It is recommended in all but the least critical database application situations to save the redo log files in the form of using the archivelog feature of the Oracle database. Archiving is often handled automatically with the use of the ARCH process, which handles the copying of online redo logs on disk to the archived destination. Archiving is highly recommended; however, there are some performance considerations that the DBA should be aware of that may put the LGWR and ARCH process in contention. If for some reason ARCH cannot archive a redo log, and LGWR fills all the online redo logs with redo information, operation on the database will stop until the DBA takes care of the archiving issue.
The issue of determining checkpoint intervals presents another interesting set of considerations for the DBA. During normal database operation, LGWR writes redo entries from the redo log buffer to disk whenever user processes commit their transactions. A checkpoint is a point in time when LGWR stops writing redo information in order to write the redo log sequence to datafile headers and to the control files of the database, and to tell DBWR to write dirty buffers from the dirty buffer write queue to disk. At the time a checkpoint occurs, performance of online applications may momentarily drop as LGWR stops writing redo log entries. The more frequent the checkpoints, the more often this performance hit will occur. However, the more checkpoints, the more current the datafiles, and the more effective the instance recovery will be in the event of a failure on the database. Decreasing the number of checkpoints is done by increasing the LOG_CHECKPOINT_INTERVAL to a number higher than the largest redo log entry or by eliminating time-based checkpoints by setting LOG_CHECKPOINT_TIMEOUT to zero. Also, checkpoints can be reduced in frequency by increasing the size of redo log files, which effectively makes the redo log files accept more entries before reaching capacity and making a switch. Finally, the CKPT process can be enabled to handle writing log sequence information to the datafile headers and the control files in place of LGWR by setting the CHECKPOINT_PROCESS to TRUE.
If user processes write redo information to the redo log buffer faster than the LGWR process can copy the redo log entries to disk, user processes may be temporarily unable to write records to the redo log buffer. If such a wait situation occurs too frequently, the space allocated to the redo log buffer can be increased. In order to determine if the user processes are waiting for space in the redo log buffer, the DBA can query the V$SYSSTAT performance view to find information in the NAME and VALUE columns, where the name in the NAME column is ‘redo log space requests’. Ideally, this statistic should be stable, and as close to zero as possible. If it is high or increasing, the DBA should increase the space allotted to the redo log buffer by changing the value for the initialization parameter LOG_BUFFER, which is expressed in bytes. However, as with resizing the shared pool size, care should be taken so as not to increase the size of the SGA so as to make it larger than what can fit in real memory.
In conclusion to this treatment of the redo log buffer, access to write redo log entries is controlled by two latches, called the redo allocation latch and the redo copy latch. There is one redo allocation latch in the entire Oracle database to ensure sequential entries to the online redo log. In heavy transaction processing application environments, there can be some contention for the redo allocation latch. Some approaches for solving that contention problem center around shortening the amount of time any process can hold the latch. There are two ways to do this. One is to reduce the size of the entry any process can write to the online redo log. This task is accomplished by the DBA by decreasing the value, expressed in bytes, for the LOG_SMALL_ENTRY_MAX_SIZE parameter. The other method is to require processes to build their redo log entry before calling Oracle for the redo allocation latch. This task is also accomplished by the DBA by setting the LOG_ENTRY_PREBUILD_THRESHOLD initialization parameter to a value in bytes that is high enough such that any redo log entry that falls below that threshold will have to be prebuilt.
The final area of tuning the Oracle SGA is the buffer cache. This area of memory is used to store a number of recently used database blocks. The principle behind the buffer cache is that more recently used buffers may be used again by the database, and if so, Oracle can speed the performance of queries requiring them by caching the blocks in memory. In order to determine if the size of the buffer cache is effective, the buffer cache hit ratio can be calculated using statistics gathered from the V$SYSSTAT dynamic performance view on the Oracle database. The statistics to be gathered are contained in this view as statistics in the VALUE column, corresponding to where the name in the NAME column equals ‘db block gets’, ‘consistent gets’, and ‘physical reads’ from this view. The calculation of the hit ratio for the buffer cache is PHYSICAL READS/(DB BLOCK GETS +CONSISTENT GETS) * 100.
As stated earlier, there are situations where the buffer cache may need to be increased or decreased, depending on the amount of memory available or added to the system and the memory requirements of other areas of the SGA. If real memory doesn’t change, and if the size of another area of SGA changes, the DBA should first consider altering the size of the buffer cache to compensate. There are two performance views that are used to determine the impact of adding or removing buffers from the buffer cache. The names for these structures are X$KCBCBH and X$KCBRBH. The method to distinguish which view assists in which function is the three-letter rule of X$: X$KCBRBH reduces buffer hits by examining increases to the buffer cache, while X$KCBCBH creates buffer hits by examining decreases to the buffer cache. Use of these views is enabled by setting the DB_BLOCK_LRU_EXTENDED_STATISTICS instance initialization parameter to TRUE.
The method by which Oracle manages space in the buffer cache was also discussed. Oracle eliminates data blocks from this cache based on the premise that blocks used least recently can be eliminated. One exception exists to prevent full table scans on large tables from eliminating all other blocks potentially being used by other processes, in that blocks loaded into the buffer cache as a result of full table scans will be eliminated first. In some cases, however, small nonindexed tables may be used to store information such as valid values that may be useful to many processes. In order to prevent the database from eliminating those blocks quickly, the DBA can identify tables that should be cached in the event that they are used via full table scan by issuing an alter table tablename cache statement.
Finally, it is important for the DBA to always remember to keep the SGA sized such that it always fits into real memory. If the SGA is sized out of real memory, the resultant paging between memory and disk will be extremely detrimental to the overall performance of the database.
| Oracle SGA consists of three parts: the shared pool, the redo log buffer, and the data block buffer cache. | |
| The shared pool contains two structures: the dictionary, or "row," cache and the library cache. | |
| The dictionary cache stores row data from the Oracle data dictionary in memory to improve performance when users select dictionary information. | |
| Performance on the dictionary cache is measured by the hit ratio, calculated from data in the V$ROWCACHE view. Hit ratio is calculated as SUM(GETMISSES) / SUM(GETS) * 100 from that view. | |
| If the row cache hit ratio is greater than 15 percent, there could be a performance issue on the database. This ratio is improved by increasing the initialization parameter SHARED_POOL_SIZE. | |
| The library cache stores parse information for SQL statements executing in the Oracle database for sharing purposes. | |
| Library cache performance is measured by the V$LIBRARYCACHE view. | |
| Library cache hit ratio is calculated as SUM(RELOADS) / SUM(PINS) * 100 from the V$LIBRARYCACHE view. | |
| A pin is when a statement executing against Oracle uses an already parsed shared version from the library cache. A reload is when the execution of a SQL statement requires reparsing that statement because the parsed version for some reason has been eliminated by Oracle from the library cache. | |
| The library cache hit ratio should be below 1 percent. This ratio is improved by increasing SHARED_POOL_SIZE or by using more identical SQL queries in the database. | |
| The redo log buffer cache stores redo entries in memory until LGWR can write them to disk. | |
| The ARCH process writes redo logs automatically from the online location to the archived location specified by LOG_ARCHIVE_DEST. | |
| If ARCH fails to write redo information to LOG_ARCHIVE_DEST, LGWR will fill all online redo logs and be unable to continue writing redo entries. All database change activity will cease until the DBA handles the situation. | |
| If the redo log buffer fills with redo information faster than LGWR can write it to online redo logs, user processes will not be able to write redo information to the redo log buffer. | |
| If user processes cannot write redo information to the redo log buffer, the DBA can identify the situation with the V$SYSSTAT performance view by selecting the statistic in the VALUE column where the NAME column equals ‘redo log space requests’. | |
| If the value for redo log space requests is not near zero, the DBA should increase the redo log buffer cache by 3–5 percent until it nears zero. The redo log buffer cache size is determined by the parameter LOG_BUFFERS. | |
| Checkpoint interval frequency represents a trade-off between online transaction processing performance and database recovery performance. Decreasing the number of checkpoints is accomplished by: |
| Access to write redo log entries is managed by the redo allocation latch. There is one redo allocation latch in the entire Oracle database. Contention for this latch can be reduced by decreasing the amount of time any process in the database can hold the latch. This is done by: |